Safe speeds - the reasons Safe speeds - the reasons
One of AT’s key priorities is keeping Aucklanders safe as we walk, cycle, bus, train, ferry, and drive. Our Vision Zero goal is to have no one die or be seriously injured on our roads by 2050. We have committed to this goal because we believe that no one should die or be seriously injured for simply getting around Tāmaki Makaurau Auckland. Safe and appropriate speed limits aim to be both safe for all road users and appropriate for the function, design and infrastructure of the road.
The case for safe speed limits
The evidence is clear, safe speed limits save lives.
Vehicle speed affects both the likelihood and severity of injuries that may result from a crash. In addition, slower vehicle speeds allow the driver to react quicker and potentially avoid the crash. Setting safe and appropriate speeds is an effective tool to save lives and prevent debilitating injuries. It could also save the life of someone you know and care about.
We know that where safe and appropriate speed limits have been implemented, injuries and deaths have reduced. Data from the first phase of speed limit changes in June 2020 showed a 30% reduction in deaths and a 21% reduction in serious injuries. In comparison, across all Auckland roads for the time period (24 months), road deaths increased by 9%.
The latest data for all speed limit changes since June 2020 showed that where speed limits have changed, there have been 44% fewer fatalities than expected if no changes had been made. Furthermore, serious injuries have decreased by 14% compared to what would have been expected without any speed limit changes. Further details can be found in the December 2023 evaluation report.
Read the full report
Safe Speeds Phase 1 interim evaluation - December 2023 (PDF, 1.8MB)
Safe Speeds Phase 2 interim evaluation - December 2023 (PDF, 1.8MB)
Safe Speeds Phases 1, 2, 3 interim evaluation - December 2023 (PDF, 1.9MB)
Safe Speeds Phase 1, 24 month interim evaluation (PDF 789KB).
Risk of death vs impact speed
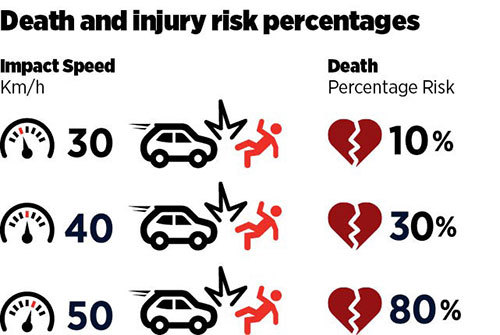
Image: Death and injury risk percentages
Survivability rates vary significantly based on a number of factors and scenarios. AT takes a preventative approach with respect to the survivability of our most vulnerable road users. Data taken from Research Report AP-R560-18 published in March 2018 by Austroads - the Association of Australian and New Zealand Road Transport and Traffic Authorities
The impact of speed on the human body
Setting safe speed limits, to what a human body can survive, is important because two out of three serious injuries are happening to people outside of vehicles. The internationally accepted speed to greatly reduce the chances of a pedestrian being killed or seriously injured is 30km/h.
For people who are walking or biking, a reduction in vehicle speed from 50km/h to 30km/h translates to a 90 percent chance of surviving the crash. Setting safe speed limits where people walking and cycling mix with vehicles, like in town centres and around schools is essential to reducing death and serious injury (DSI).
Safe speed limits save lives
Speed makes a major difference in a crash. It affects a driver’s ability to react and stop in time. Regardless of the cause of a crash, speed is the difference between someone being unharmed or being seriously injured or killed.
Making our roads safer
Aotearoa, New Zealand’s road safety performance is significantly worse than that of the world’s best-performing countries. Countries similar to Aotearoa in terms of geography, population and culture have embedded Vision Zero and Safe System principles into their road safety strategies, drastically reducing the number of road deaths and serious injuries.
New Zealand's rank in international road safety performance

Road fatalities per 100,000 population 2018 International Transport Forum’s Road Safety Annual Report 2020 – OECD countries
As speed increases, so does the likelihood of serious injury or death because of the following reasons:
- the driver has less time to react to a hazard
- the distance travelled before coming to a stop is greater
- the speed upon impact is greater
Introducing Katoa, Ka Ora (PDF 4.72MB)
Environment and climate change
While safety is the reason for speed management, it also helps with reducing emissions.
Recent research shows although changes in vehicle speed can affect emissions, the overall impact in Auckland is expected to be small.
To reduce vehicle emissions, we need to encourage more use of public transport, walking and cycling. By making it safer to walk and cycle, speed management is a critical component of our emission reduction pathway for Auckland and New Zealand.
- The effect of speed on emissions summary report September 2023 (PDF 1MB)
- Overview Effect of speed on emissions summary of investigations undertaken by EIL and EMM consulting May 2023 (PDF 2.38MB)
- Estimated effect of mode shift and speed interventions report on motor vehicle emissions and air pollution health impacts in Auckland May23 (PDF 913KB)
The social cost
On top of leaving a huge hole in the lives of families, friends, workplaces and communities, road crashes have a huge impact on our society.
The value of statistical life (VOSL) was estimated at $12.5 million per fatality and $660,100 per serious injury at July 2021 prices. There are significant social costs resulting from fatalities and serious injuries where speed has been a contributing factor.
Equity in road harm in Auckland
This research explores equity in road harm in Auckland considering age, ethnicity, mode of travel and deprivation. The analysis looks at data from the Waka Kotahi Crash Analysis System, Stats NZ population data, and the Ministry of Transport Household Travel Survey.
Download the full report: Equity in road harm in Auckland 2022 (PDF 5.05MB).