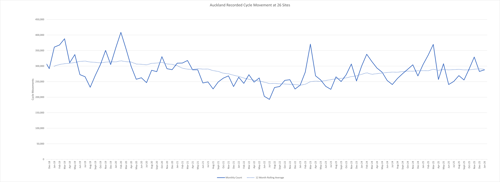
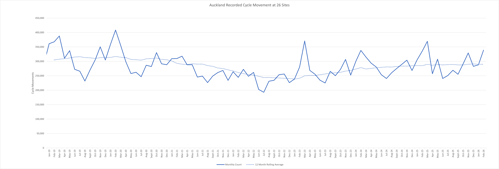
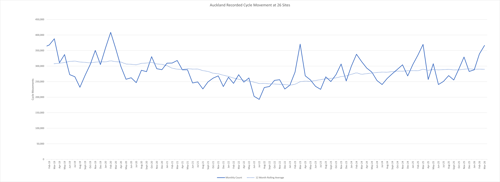
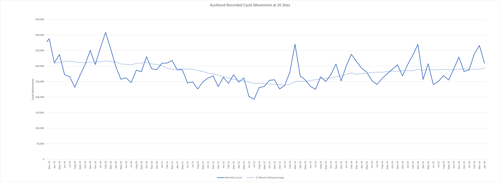
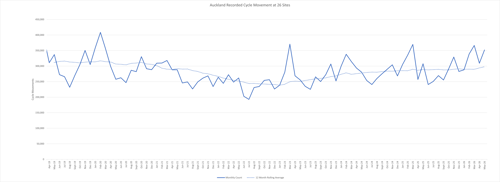
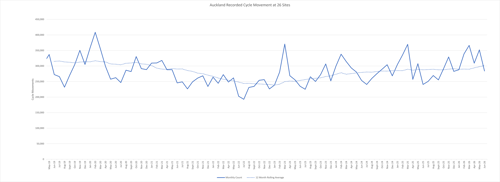
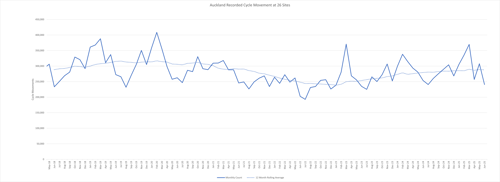
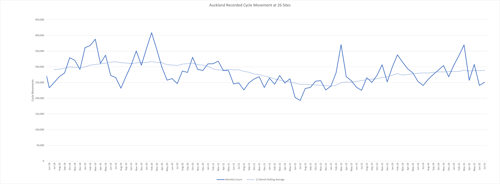
Monthly cycle monitoring Monthly cycle monitoring
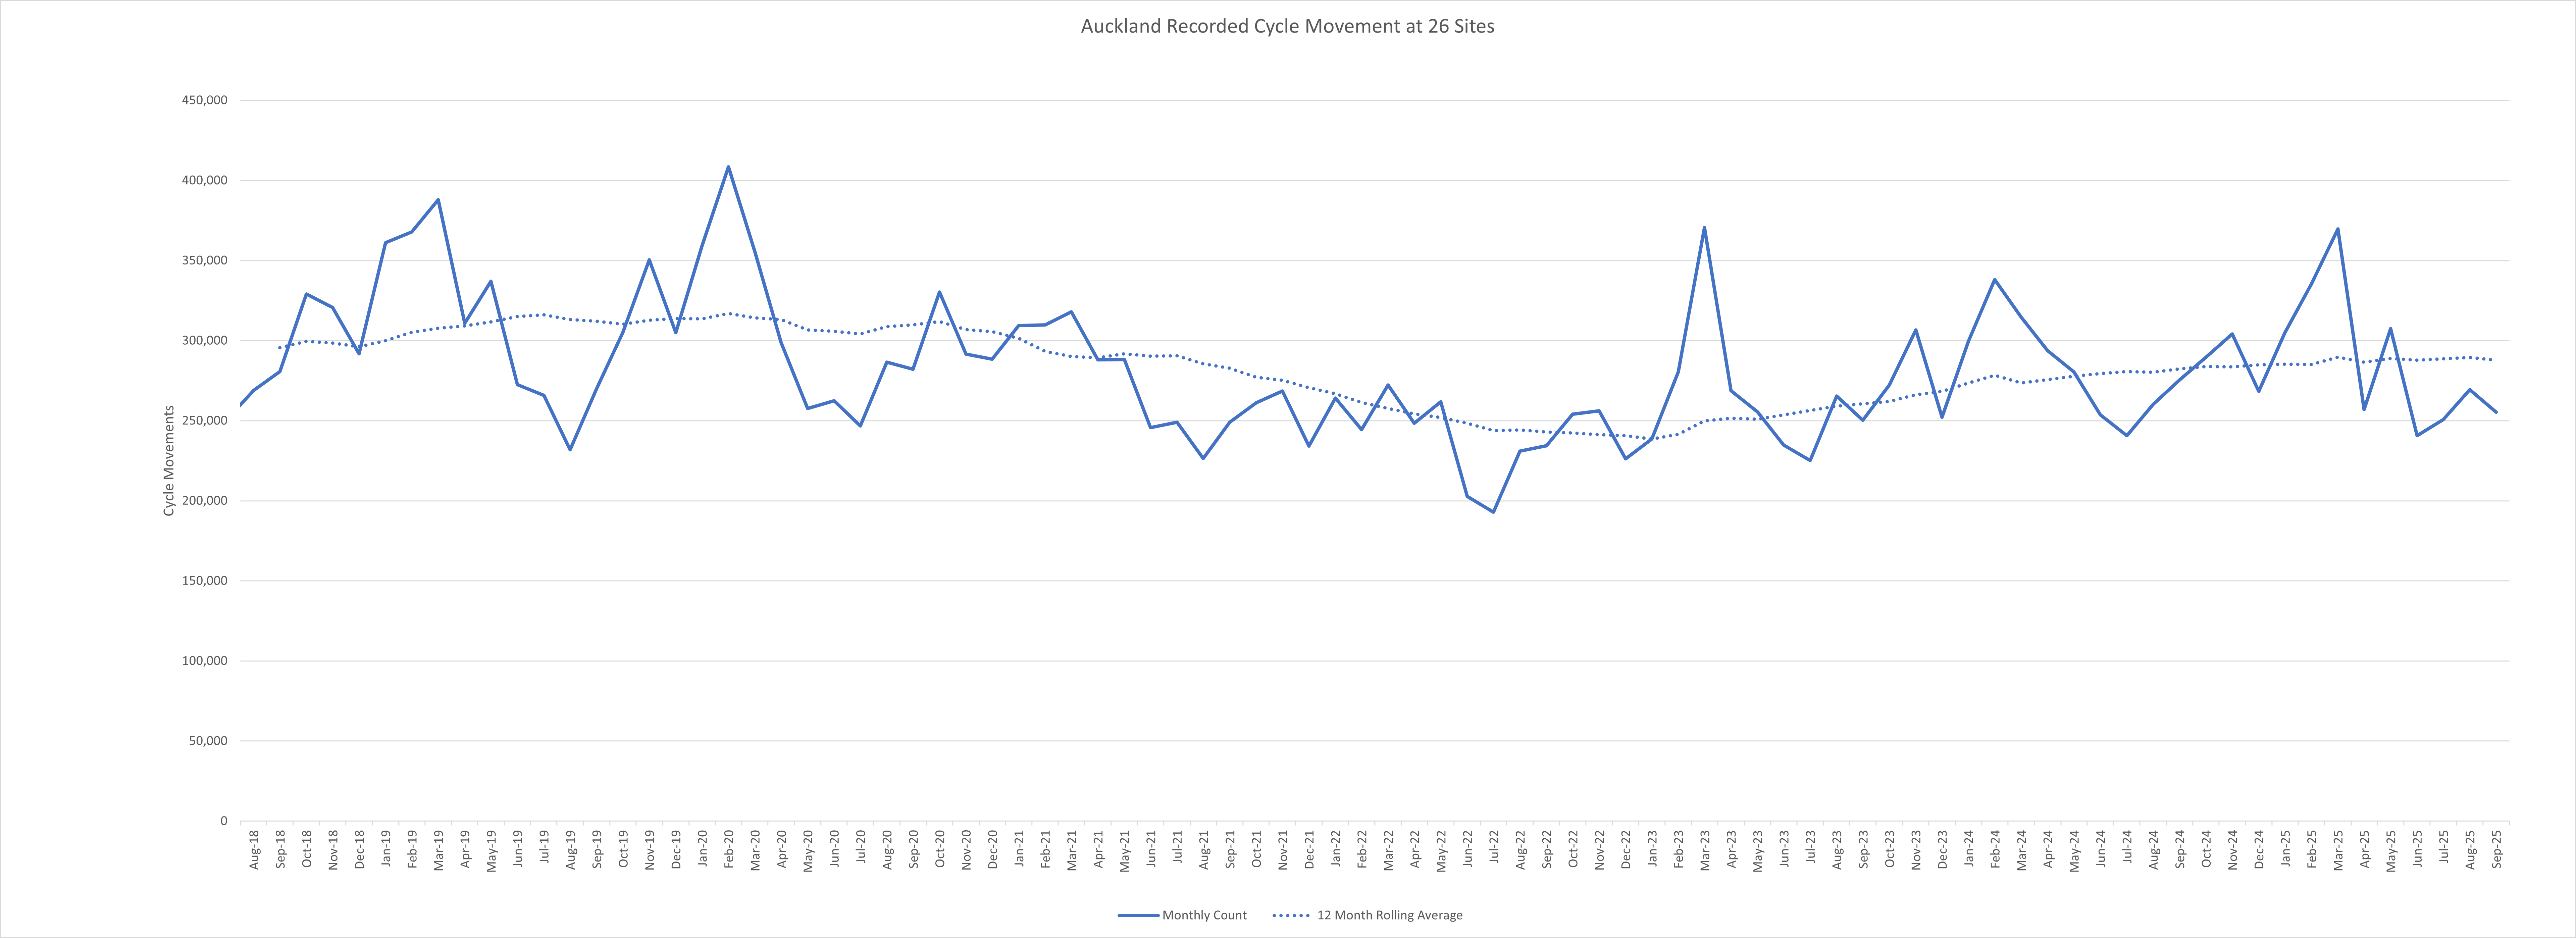
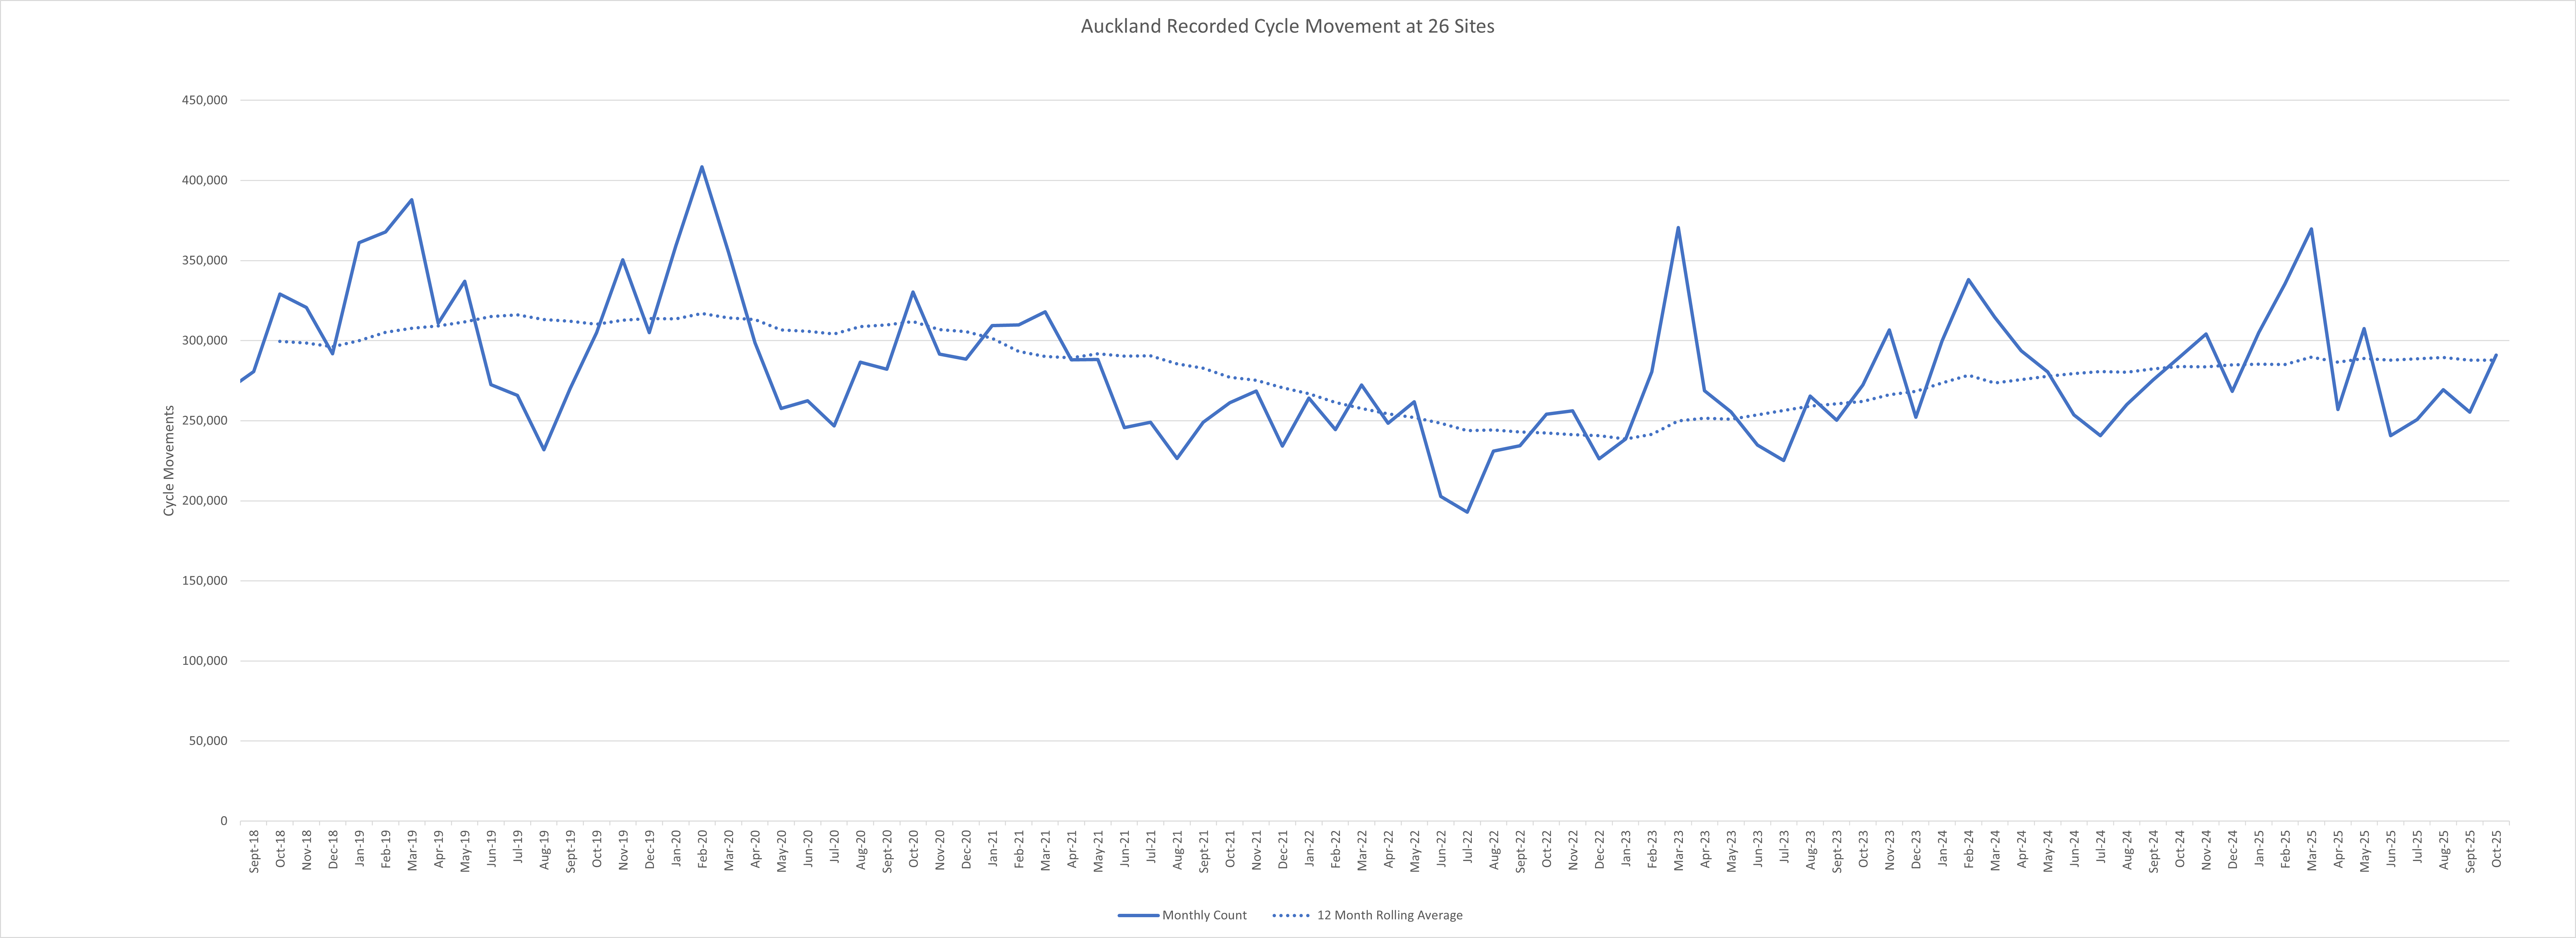
The number of cycle movements in Auckland is collected at sites across the region using permanent, automated cycle-monitoring equipment.
As of July 2018, AT reports on 26 cycle counters, located throughout the city.
Daily data from all counters are available to download.
 This work is licensed under a Creative Commons Attribution 4.0 International License.
2026 monthly cycle monitoring reports
January 2026 automatic cycle counts
At 26 count sites:
- from February 2025 to January 2026, we recorded a total of 3.5 million cycle movements, indicating a 1.5% increase compared to the corresponding 12-month period from the previous year
- January 2026 saw 288,039 cycle movements, 5.6% fall from January 2025
- financial year-to-date target met.
Download the automatic cycle counter data for January 2026 (XLSX, 33KB)
February 2026 automatic cycle counts
At 26 count sites:
- From March 2025 to February 2026, we recorded a total of 3.5 million cycle movements,
indicating a 1.7% increase compared to the corresponding 12-month period from the previous
year. - February 2026 saw 338,978 cycle movements, 1.1% rise from February 2025.
- Financial year-to-date target met.
Download the automatic cycle counter data for February 2026 (XLSX, 33KB)
March 2026 automatic cycle counts
At 26 count sites:
- From April 2025 to March 2026, we recorded a total of 3.5 million cycle movements, indicating a 0.0% increase compared to the corresponding 12-month period from the previous year
- March 2026 saw 366,386 cycle movements, 0.9% fall from March 2025
- Financial year-to-date target met.
Download the automatic cycle counter data for March 2026 (XLSX, 35KB)
April 2026 automatic cycle counts
At 26 count sites:
- From May 2025 to April 2026, we recorded a total of 3.5 million cycle movements, indicating a 2.6% increase compared to the corresponding 12-month period from the previous year
- April 2026 saw 309,197 cycle movements, 20.3% rise from April 2025
- Financial year-to-date target met.
Download the automatic cycle counter data for April 2026 (XLSX, 34KB)
May 2026 automatic cycle counts
At 26 count sites:
- From June 2025 to May 2026, we recorded a total of 3.6 million cycle movements, indicating a 3.1% increase compared to the corresponding 12-month period from the previous year
- May 2026 saw 351,894 cycle movements, 14.4% rise from May 2025
- Financial year-to-date target met.
Download the automatic cycle counter data for May 2026 (XLSX, 35KB)
June 2026 automatic cycle counts
At 26 count sites:
- From July 2025 to June 2026, we recorded a total of 3.6 million cycle movements, indicating a 4.7% increase compared to the corresponding 12-month period from the previous year
- June 2026 saw 284,003 cycle movements, 18.0% rise from June 2025
- Financial year-to-date target met.
Download the automatic cycle counter data for June 2026 (XLSX, 34KB)
2025 monthly cycle monitoring reports
January 2025 automatic cycle counts
At 26 count sites:
- from February 2024 to January 2025, we recorded a total of 3.4 million cycle movements, indicating an 8.3% increase compared to the corresponding 12-month period from the previous year
- January 2025 saw 304,988 cycle movements, a 1.7% rise from January 2024
- the target value for financial year 2024 to 2025 has been met.
Download the automatic cycle counter data for January 2025 (XLSX, 30KB).

February 2025 automatic cycle counts
At 26 count sites:
- from March 2024 to February 2025, we recorded a total of 3.4 million cycle movements, indicating a 4.5% increase compared to the corresponding 12-month period from the previous year
- February 2025 saw 335,331 cycle movements, a 0.8% fall from February 2024
- the target value for financial year 2024 to 2025 has been met.
Download the automatic cycle counter data for February 2025 (XLSX, 29KB).

March 2025 automatic cycle counts
At 26 count sites:
- from April 2024 to March 2025, we recorded a total of 3.5 million cycle movements, indicating a 5.9% increase compared to the corresponding 12-month period from the previous year
- March 2025 saw 369,641 cycle movements, a 17.5% rise from March 2024
- the target value for financial year 2024 to 2025 has been met.
Download the automatic cycle counter data for March 2025 (XLSX, 34KB).

April 2025 automatic cycle counts
At 26 count sites:
- from May 2024 to April 2025, we recorded a total of 3.4 million cycle movements, indicating a 4.0% increase compared to the corresponding 12-month period from the previous year
- April 2025 saw 256,980 cycle movements, 12.5% fall from April 2024
- the target value for financial year 2024 to 2025 has been met.
Download the automatic cycle counter data for April 2025 (XLSX, 34KB).

May 2025 automatic cycle counts
At 26 count sites:
- from June 2024 to May 2025, we recorded a total of 3.5 million cycle movements, indicating an 4.0% increase compared to the corresponding 12-month period from the previous year
- May 2025 saw 307,581 cycle movements, 9.7% rise from May 2024
- the target value for FY 24/25 has been met.
Download the automatic cycle counter data for May 2025 (XLSX, 32KB).

June 2025 automatic cycle counts
At 26 count sites:
- from July 2024 to June 2025, we recorded a total of 3.5 million cycle movements, indicating a 3.0% increase compared to the corresponding 12-month period from the previous year
- June 2025 saw 240,681 cycle movements, a 5.1% fall from June 2024
- the target value for financial year 2024 to 2025 has been met.
Download the automatic cycle counter data for June 2025 (XLSX, 32KB).
July 2025 automatic cycle counts
At 26 count sites:
- from August 2024 to July 2025, we recorded a total of 3.5 million cycle movements, indicating an 2.8% increase compared to the corresponding 12-month period from the previous year
- July 2025 saw 250,673 cycle movements, 4.2% rise from July 2024
- the target value for FY 24/25 has been met.
Download the automatic cycle counter data for July 2025 (XLXS, 33KB)
August 2025 automatic cycle counts
At 26 count sites:
- From September 2024 to August 2025, we recorded a total of 3.5 million cycle movements, indicating a 3.3% increase compared to the corresponding 12-month period from the previous year.
- August 2025 saw 269,254 cycle movements, a 3.5% rise from August 2024.
- The target value for financial year 2024 to 2025 has been met.
Download the automatic cycle counter data for August 2025 (XLSX, 33KB).

September 2025 automatic cycle counts
At 26 count sites:
- we recorded a total of 3.5 million cycle movements from October 2024 to September 2025, indicating a 1.9% increase compared to the corresponding 12-month period from the previous year
- September 2025 saw 255,348 cycle movements, 7.3% fall from September 2024
- the target value for FY 24/25 has been met.
Download the automatic cycle counter data for September 2025 (XLSX, 32KB).
October 2025 automatic cycle counts
26 count sites:
- from November 2024 to October 2025, we recorded a total of 3.5 million cycle movements, indicating a 1.4% increase compared to the corresponding 12-month period from the previous year
- October 2025 saw 291,026 cycle movements, 0.4% rise from October 2024
- The target value for FY 24/25 has been met
Download the automatic cycle counter data for October 2025 (XLSX, 35KB).
November 2025 automatic cycle counts
At 26 count sites:
- from December 2024 to November 2025, we recorded a total of 3.5 million cycle movements, indicating an 2.2% increase compared to the corresponding 12-month period from the previous year
- November 2025 saw 329,120 cycle movements, 8.2% rise from November 2024
- financial year-to-date target met.
Download the automatic cycle counter data for November 2025 (XLSX, 34KB).

December 2025 automatic cycle counts
At 26 count sites:
- from January 2025 to December 2025, we recorded a total of 3.5 million cycle movements, indicating a 2.2% increase compared to the corresponding 12-month period from the previous year
- December 2025 saw 282,720 cycle movements, 5.4% rise from December 2024
- financial year-to-date target exceeded.
Download the automatic cycle counter data for December 2025 (XLSX, 34KB).

2024 monthly cycle monitoring reports
January 2024 automatic cycle counts
At 26 count sites:
- A total of 3.28 million cycle movements were recorded from February 2023 to January 2024, marking a 14.6% increase compared to the previous 12 months.
- 299,833 cycle movements were recorded in January 2024, representing a 25.6% increase compared to January 2023.
- The target value for FY 23/24 has been met.
Download the automatic cycle counter data for January 2024 (XLSX, 20KB)

February 2024 automatic cycle counts
At 26 count sites:
- From March 2023 to February 2024, a total of 3.34 million cycle movements were recorded, showing a 15.2% increase compared to the previous 12 months.
- February 2024 saw 337,996 cycle movements, a 20.5% rise from February 2023.
- The target value for FY 23/24 has been met.
Download the automatic cycle counter data for February 2024 (XLSX, 22KB)

March 2024 automatic cycle counts
At 26 count sites:
- From April 2023 to March 2024, a total of 3.28 million cycle movements were recorded, indicating a 9.5% increase compared to the previous 12 months.
- March 2024 saw 314,671 cycle movements, a 15.1% decrease from March 2023.
- The target value for FY 23/24 has been met.
Download the automatic cycle counter data for March 2024 (XLSX, 31KB)

April 2024 automatic cycle counts
At 26 count sites:
- From May 2023 to April 2024, a total of 3.31 million cycle movements were recorded, indicating a 9.6% increase compared to the previous 12 months.
- April 2024 saw 293,762 cycle movements, a 9.3% rise from April 2023.
- The target value for FY 23/24 has been met.
Download the automatic cycle counter data for April 2024 (XLSX, 31KB)

May 2024 automatic cycle counts
At 26 count sites:
- From June 2023 to May 2024, a total of 3.33 million cycle movements were recorded, indicating a 10.7% increase compared to the previous 12 months.
- May 2024 saw 280,444 cycle movements, a 9.8% rise from May 2023.
- The target value for FY 23/24 has been met.
Download the automatic cycle counter data for May 2024 (XLSX, 23KB)

June 2024 automatic cycle counts
At 26 count sites:
- From July 2023 to June 2024, a total of 3.35 million cycle movements were recorded, indicating a 10.2% increase compared to the corresponding 12-month period from the previous year.
- June 2024 saw 253,740 cycle movements, 8% rise from June 2023.
- The target value for FY 23/24 has been met.
Download the automatic cycle counter data for June 2024 (XLSX, 20KB)
July 2024 automatic cycle counts
At 26 count sites:
- From August 2023 to July 2024, a total of 3.37 million cycle movements were recorded, indicating a 9.5% increase compared to the corresponding 12-month period from the previous year.
- July 2024 saw 240,579 cycle movements, a 6.9% rise from July 2023.
- The target value for FY 24/25 has been met.
Download the automatic cycle counter data for July 2024 (XLSX, 33KB)

August 2024 automatic cycle counts
At 26 count sites:
- From August 2023 to August 2024, a total of 3.36 million cycle movements were recorded, indicating an 8.1% increase compared to the corresponding 12-month period from the previous year.
- August 2024 saw 260,176 cycle movements, a 2.0% fall from August 2023.
- The target value for FY 24/25 has been met.
Download the automatic cycle counter data for August 2024 (XLSX, 34KB)

September 2024 automatic cycle counts
At 26 count sites:
- from September 2023 to September 2024, we recorded a total of 3.39 million cycle movements, indicating an 8.4% increase compared to the corresponding 12-month period from the previous year
- September 2024 saw 275,358 cycle movements, a 10% rise from September 2023
- the cumulative cycle movement for this financial year now exceeds the target by 7.7%.
Download the automatic cycle counter data for September 2024 (XLSX, 35KB)
October 2024 automatic cycle counts
At 26 count sites:
- from October 2023 to October 2024, we recorded a total of 3.4 million cycle movements, indicating an 8.1% increase compared to the corresponding twelve-month period from the previous year
- October 2024 saw 283,793 cycle movements, 4.3% rise from October 2023
- the cumulative cycle movement for this financial year now exceeds the target by 7.5%.
Download the automatic cycle counter data for October 2024 (XLSX, 30KB)
November 2024 automatic cycle counts
At 26 count sites:
- from November 2023 to November 2024, we recorded a total of 3.4 million cycle movements, indicating an 7.6% increase compared to the corresponding 12-month period from the previous year
- November 2024 saw 296,505 cycle movements, 3.3% rise from November 2023
- the cumulative cycle movement for this financial year now exceeds the target by 6.1%.
Download the automatic cycle counter data for November 2024 (XLSX, 30KB)

December 2024 automatic cycle counts
At 26 count sites:
- from December 2023 to December 2024, we recorded a total of 3.4 million cycle movements, indicating an 7.3% increase compared to the corresponding 12-month period from the previous year
- December 2024 saw 261,353 cycle movements, 3.6% rise from December 2023
- the cumulative cycle movement for this financial year now exceeds the target by 5.5%.
Download the automatic cycle counter data for December 2024 (XLSX, 2.3MB)

2023 monthly cycle monitoring reports
December 2023 automatic cycle counts
At 26 count sites:
- A total of 3.22 million cycle movements were recorded from January 2023 to December 2023, marking a 11.5% increase compared to the previous 12 months.
- 252,257 cycle movements were recorded in December 2023, representing a 11.5% increase compared to December 2022.
- The target value for FY 23/24 has been met.
Download the automatic cycle counter data for December 2023 (XLSX, 20KB)

November 2023 automatic cycle counts
At 26 count sites:
- A total of 3.19 million cycle movements were recorded from December 2022 to November 2023, marking a 10.3% increase compared to the previous 12 months.
- 306,744 cycle movements were recorded in November 2023, representing a 19.8% increase compared to November 2022.
- The target value for FY 23/24 has been met.
Download the automatic cycle counter data for November 2023 (XLSX, 20KB)

October 2023 automatic cycle counts
At 26 count sites:
- A total of 3.14 million cycle movements were recorded from September 2022 to October 2023, marking a 8.1% increase compared to the previous 12 months.
- 272,198 cycle movements were recorded in October 2023, representing a 7.2% increase compared to October 2022.
- The target value for FY 23/24 has been met.
Download the 2023 automatic cycle counter data for October 2023 (XLSX, 20KB).

September 2023 automatic cycle counts
At 26 count sites:
- A total of 3.13 million cycle movements were recorded from August 2022 to September 2023, marking a 7.2% increase compared to the previous 12 months.
- 250,236 cycle movements were recorded in September 2023, representing a 6.8% increase compared to September 2022.
- The target value for FY 23/24 has been met.
Download the 2023 automatic cycle counter data for September 2023 (XLSX, 20KB).
 \
\
August 2023 automatic cycle counts
At 26 count sites:
- 3.11 million cycle movements were recorded for the year of September 2022 to August 2023 an increase of 5.1% on the previous 12 months.
- 265,361 cycle movements were recorded in August 2023, 14.8% increase compared to August 2022.
- The target value for FY 23/24 was met.
Download the 2023 automatic cycle counter data for August 2023 (XLSX, 20KB).

July 2023 automatic cycle counts
At 26 count sites:
- 3.07 million cycle movements were recorded for the year of August 2022 to July 2023 an increase of 5.1% on the previous 12 months.
- 225,140 cycle movements were recorded in July 2023, 16.7% increase compared to July 2022.
- The target value for FY 23/24 was met.
Download the 2023 automatic cycle counter data for July 2023 (XLSX, 20KB).

June 2023 automatic cycle counts
At 26 count sites:
- 3.043 million cycle movements were recorded for the year of July 2022 to June 2023 an increase of 2.1% on the previous 12 months.
- 238,841 cycle movements were recorded in June 2023, 15.8% increase compared to June 2022.
- The target value for FY 22/23 was missed by 21%.
Download the 2023 automatic cycle counter data for June 2023 (XLSX, 24KB).

May 2023 automatic cycle counts
At 26 count sites:
- 3.0 million cycle movements were recorded for the year of April 2022 to May 2023 a decrease of 0.4% on the previous 12 months.
- 255,498 cycle movements were recorded in May 2023, 2,4% decrease compared to May 2022.
- The target value for FY 22/23 was missed by 21.6%.
Download the 2023 automatic cycle counter data for May 2023 (XLSX, 24KB).

April 2023 automatic cycle counts
At 26 count sites:
- 3.0 million cycle movements were recorded for the year of March 2022 to April 2023 a decrease of 1.1% on the previous 12 months.
- 268,768 cycle movements were recorded in April 2023, 8.2% increase compared to April 2022.
- The target value for FY 22/23 was missed by 21.4%.
Download the 2023 automatic cycle counter data for April 2023 (XLSX, 24KB).

March 2023 automatic cycle counts
At 26 count sites:
- 3.0 million cycle movements were recorded for the year of February 2022 to March 2023 a decrease of 3% on the previous 12 months.
- 370,592 cycle movements were recorded in March 2023, 36.1% increase compared to March 2022.
- The target value for FY 22/23 was missed by 22%.
Download the 2023 Automatic cycle counter data for March 2023 (XLSX, 36KB).

February 2023 automatic cycle counts
At 26 count sites:
- 2.90 million cycle movements were recorded for the year of March 2022 to February 2023 a decrease of 7.6% on the previous 12 months.
- 280,394 cycle movements were recorded in February 2023, 14.7% increase compared to February 2022.
- The target value for FY 22/23 was missed by 24.8%.
Download the 2023 Automatic cycle counter data for February 2023 (XLSX, 35KB).

January 2023 automatic cycle counts
At 26 count sites:
- 2.86 million cycle movements were recorded for the year of February 2022 to January 2023 a decrease of 10.6% on the previous 12 months.
- 238,651 cycle movements were recorded in January 2023, 9.6% decrease compared to January 2022.
- The target value for FY 22/23 was missed by 25.7%.
Download the 2023 Automatic cycle counter data for January 2023 (XLSX, 36KB).

2022 monthly cycle monitoring reports

Download the January 2022 to December 2022 Auckland cycle counter data. (XLSX, 124KB).
December 2022 automatic cycle counts
At 26 count sites:
- 2.89 million cycle movements were recorded for the year of January 2021 to December 2022 a decrease of 11.1% on the previous 12 months.
- 226,238 cycle movements were recorded in December 2022, 3.4% decrease compared to December 2021.
- The target value for FY 22/23 was missed by 23.7%.

November 2022 automatic cycle counts
At 26 count sites:
- 2.90 million cycle movements were recorded for the year of December 2021 to November 2022 a decrease of 12.3% on the previous 12 months.
- 256,138 cycle movements were recorded in November 2021, 4.6% decrease compared to November 2021.
- The target value for FY 22/23 was missed by 22.5%.

October 2022 automatic cycle counts
At 26 count sites:
- 2.91 million cycle movements were recorded for the year of November 2021 to October 2022 a decrease of 12.5% on the previous 12 months.
- 253,992 cycle movements were recorded in October 2021, 2.7% decrease compared to October 2021.
- The target value for FY 21/22 was missed by 21.4%.

September 2022 automatic cycle counts
At 26 count sites:
- 2.92 million cycle movements were recorded for the year of October 2021 to September 2022 a decrease of 14.1% on the previous 12 months.
- 234,300 cycle movements were recorded in September 2021, 5.9% decrease compared to September 2021.
- The target value for FY 21/22 was missed by 20.9%.

August 2022 automatic cycle counts
At 26 count sites:
- 2.93 million cycle movements were recorded for the year of September 2021 to August 2022 a decrease of 14.5% on the previous 12 months.
- 231,082 cycle movements were recorded in May 2021, 2.1% increase compared to August 2021.
- The target value for FY 21/22 was missed by 22.5%.

July 2022 automatic cycle counts
At 26 count sites:
- 2.92 million cycle movements were recorded for the year of August 2021 to July 2022 a decrease of 16.1% on the previous 12 months.
- 192,950 cycle movements were recorded in July 2022, 22.5% decrease compared to July 2021.
- The target value for FY 22/23 was missed by 27.4%.

June 2022 automatic cycle counts
At 26 count sites:
- 2.98 million cycle movements were recorded for the year of July 2021 to June 2022 a decrease of 14.4% on the previous 12 months.
- 202,830 cycle movements were recorded in June 2022, 17.4% decrease compared to June 2021.
- The target value for FY 21/22 was missed by 22.2%
May 2022 automatic cycle counts
At 26 count sites:
- 3.0 million cycle movements were recorded for the year of June 2021 to May 2022, a decrease of 13.6% on the previous 12 months.
- 261,756 cycle movements were recorded in May 2022, a 9.2% decrease compared to May 2021.
- The target value for FY 21/22 was missed by 18.5%.

April 2022 automatic cycle counts
- 3.1 million cycle movements were recorded for the year of May 2021 to April 2022, a decrease of 12.1% on the previous 12 months.
- 248,393 cycle movements were recorded in April 2022, 13.8% decrease compared to April 2021.
- The target value for FY 21/22 was missed by 18.6%.
![]()
March 2022 automatic cycle counts
At 26 count sites:
- 3.1 million cycle movements were recorded for the year of April 2021 to March 2022, a decrease of 11.2% on the previous 12 months.
- 272,302 cycle movements were recorded in March 2022, 14.4% decrease compared to March 2021.
- The target value for FY 21/22 was missed by 18.6%.
February 2022 automatic cycle counts
At 26 count sites:
- 3.1 million cycle movements were recorded for the year of March 2021 to February 2022, a decrease of 10.9% on the previous 12 months.
- 244,422 cycle movements were recorded in February 2022, 21.1% decrease compared to February 2021.
- The target value for FY 21/22 was missed by 17.6%.
January 2022 automatic cycle counts
At 26 count sites:
- 3.2 million cycle movements were recorded for the year of February 2021 to January 2022 a decrease of 11.5% on the previous 12 months.
- 234,184 cycle movements were recorded in January 2022, 18.8% decrease compared to January 2021.
- The target value for FY 21/22 was missed by 15.8%.
2021 monthly cycle monitoring reports
- The Nelson St counter and Quay St display temporary counter have had their settings adjusted to detect scooters and similar devices such as skateboards. Neither of these counters are part of the 26 counters grouped above. We are closely monitoring this to ensure it doesn’t harm the quality of counts before adjusting the setting of all counters. Current technology cannot distinguish between cycles and scooters.
- The Quay Street display cycle counter stopped working on 27th November 2018. Since then we have laid a temporary counter. We have estimated missing data based on historic data.
- The Great North Road cycle counter stopped working due to technical issues.
- The Victoria Street counter was removed due to construction work.
- The Tamaki Drive (EB) cycle counter was removed during the construction of the new cycleway on Tamaki Drive. A pair of CCTV cameras were set up to monitor cycle counts. The cameras stopped operating from 9 April 2021, so there was no data from that.

Download the January 2021 to December 2021 Auckland cycle counter data. (XLSX, 102KB)
December 2021 automatic cycle counts
At 26 count sites:
- 3.2 million cycle movements were recorded for the year of January 2021 to December 2021. This was a decrease of 11.4% compared on the previous 12 months.
- 234,184 cycle movements were recorded in December 2021, a 18.8% decrease compared to December 2020.
- The target value for the 2021 to 2022 Financial Year was missed by 14.4%.
November 2021 automatic cycle counts
At 26 count sites:
- 3.3 million cycle movements were recorded for the year of December 2020 to November 2021, a decrease of 10.4% on the previous 12 months.
- 268,546 cycle movements were recorded in November 2021, 7.9% decrease compared to November 2020.
- The target value for FY 21/22 was missed by 12.6%.
October 2021 automatic cycle counts
At 26 count sites:
- 3.3 million cycle movements were recorded for the year of November 2020 to October 2021, a decrease of 11.2% on the previous 12 months.
- 261,096 cycle movements were recorded in October 2021, a 20.9% decrease compared to October 2020.
- The target value for FY 21/22 was missed by 10.8%.
September 2021 automatic cycle counts
At 26 count sites:
- 3.4 million cycle movements were recorded for the year of October 2020 to September 2021, a decrease of 8.7% on the previous 12 months.
- 249.038 cycle movements were recorded in September 2021, a 11.7% decrease compared to September 2020.
- The target value for FY 21/22 was missed by 8.6%.
August 2021 automatic cycle counts
At 26 count sites:
- 3.4 million cycle movements were recorded for the year of September 2020 to August 2021, a decrease of 7.5% on the previous 12 months.
- 226,362 cycle movements were recorded in August 2021, a 21% decrease compared to August 2020.
- The target value for FY 21/22 was missed by 8.8%.
July 2021 automatic cycle counts
At 26 count sites:
- 3.5 million cycle movements were recorded for the year of August 2020 to July 2021, a decrease of 4.5% on the previous 12 months.
- 248,991 cycle movements were recorded in July 2021, 1% increase compared to July 2020.
- The target value for FY 21/22 was missed by 1.7%.
June 2021 automatic cycle counts
At 26 count sites:
- 3.5 million cycle movements were recorded for the year July 2020 to June 2021, a decrease of 5% on the previous 12 months.
- 245,618 cycle movements were recorded in June 2021, a 6.4% decrease compared to June 2020.
April 2021 automatic cycle counts
At 26 count sites:
- 3.5 million cycle movements were recorded for the year of May 2020 to April 2021, a decrease of 7.7% on the previous 12 months.
- 288,097 cycle movements were recorded in April 2021, a 3.6% decrease compared to April 2020, when Auckland was under Alert Level 4, and 7.3% lower than April 2019.
March 2021 automatic cycle counts
At 26 count sites:
- 3.5 million cycle movements were recorded for the year of April 2020 to March 2021, a decrease of 7.7% on the previous 12 months.
- 317,975 cycle movements were recorded in March 2021, a 10.5% decrease compared to March 2020.
February 2021 automatic cycle counts
At 26 count sites:
- 3.5 million cycle movements were recorded for the year of March 2020 to February 2021, a decrease of 7.5% on the previous 12 months.
- 309,716 cycle movements were recorded in February 2021, a 24.2% decrease compared to February 2020.
January 2021 automatic cycle counts
At 26 count sites:
- 3.6 million cycle movements were recorded for the year of February 2020 to January 2021, a decrease of 3.9% on the previous 12 months.
- 309,387 cycle movements were recorded in January 2021, a 13.8% decrease compared to January 2020.
2020 monthly cycle monitoring reports
- The Nelson St counter and Quay St display temporary counter have had their settings adjusted to detect scooters and other similar devices such as skateboards. Neither of these counters are part of the 26 counters grouped above. We are closely monitoring this to ensure it doesn’t adversely affect the quality of counts before adjusting the setting of all counters. Note that it is not possible with current technology to distinguish between cycles and scooters.
- The Quay Street display cycle counter stopped working on 27th November 2018. Since then a temporary counter has been laid. Missing data has been estimated based on historic data.
- Great North Road cycle counter stopped working due to technical issue. Victoria Street cycle counter has been removed due to construction work.
- Tamaki Drive (EB) cycle counter has been removed during the construction of the new cycleway on Tamaki Drive.
- New cycle counter has been installed on Westhaven Drive.
December 2020 automatic cycle counts
At 26 count sites:
- 3.7 million cycle movements were recorded for the year of January 2020 to December 2020, a decrease of 2.6% on the previous 12 months.
- 288,466 cycle movements were recorded in December 2020, a 5.4% decrease compared to December 2019.
Download the December 2020 automatic cycle counter data (CSV, 7KB)
November 2020 automatic cycle counts
At 26 count sites:
- 3.7 million cycle movements were recorded for the year of December 2019 to November 2020, a decrease of 1.8% on the previous 12 months.
- 291,482 cycle movements were recorded in November 2020, a 16.8% decrease compared to November 2019.
Download the November 2020 automatic cycle counter data (CSV, 31KB)
October 2020 automatic cycle counts
At 26 count sites:
- 3.7 million cycle movements were recorded for the year of November 2019 to October 2020, an increase of 0.5% on the previous 12 months.
- 330,000 cycle movements were recorded in October 2020, a 8.3% increase compared to October 2019.
Download the October 2020 automatic cycle counter data (CSV, 7KB)
September 2020 automatic cycle counts
At 26 count sites:
- 3.7 million cycle movements were recorded for the year of October 2019 to September 2020, a decrease of 0.8% on the previous 12 months.
- 282,000 cycle movements were recorded in September 2020, a 4.5% increase compared to September 2019.
Download the September 2020 automatic cycle counter data (CSV, 7KB)
August 2020 automatic cycle counts
At 26 count sites:
- 3.7 million cycle movements were recorded for the year of September 2019 to August 2020, a decrease of 1.4% on the previous 12 months.
- 287,000 cycle movements were recorded in August 2020, a 23.6% increase compared to August 2019.
Download the August 2020 automatic cycle counter data (CSV, 7KB)
July 2020 automatic cycle counts
At 26 count sites:
- 3.65 million cycle movements were recorded for the year of August 2019 to July 2020, a decrease of 3.8% on the previous 12 months.
- 247,000 cycle movements were recorded in July 2020, a 7.2% decrease compared to July 2019.
Download the July 2020 automatic cycle counter data (XLSX, 25KB)
June 2020 automatic cycle counts
At 26 count sites:
- 3.7 million cycle movements were recorded for the year of July 2019 to June 2020, a decrease of 2.9% on the previous 12 months.
- 262,000 cycle movements were recorded in June 2020, a 4% decrease compared to June 2019.
- During Alert levels 2 and then 1, commuter cycling increased compared to May 2020, but did not reach the expected levels.
Download the June 2020 automatic cycle counter data (CSV, 7KB)
May 2020 automatic cycle counts
At 26 count sites:
- 3.7 million cycle movements were recorded for the year of May 2019 to May 2020, a decrease of 1.6% on the previous 12 months.
- 258,000 cycle movements were recorded in May 2020, a 24% decrease compared to May 2019.
- Due to the Covid-19 situation, the commuter cyclist movements have decreased significantly after the lockdown, due to increased wet weather conditions, recreational cycle movements did not reach the levels of previous months.
Download the May 2020 automatic cycle counter data (CSV, 7KB)
April 2020 automatic cycle counts
At 26 count sites:
- 3.8 million cycle movements were recorded for the year of April 2019 to April 2020, an increase of 1.3% on the previous 12 months.
- 298,000 cycle movements were recorded in April 2020, a 4% decrease compared to April 2019.
- Due to the Covid-19 situation, the commuter cyclist movements have decreased significantly after the lockdown, but recreational cyclist movements have increased in residential areas.
Download the April 2020 automatic cycle counter data (CSV, 7KB)
March 2020 automatic cycle counts
At 26 count sites:
- 3.8 million cycle movements were recorded for the year of March 2019 to March 2020, an increase of 2.1% on the previous 12 months.
- 355,000 cycle movements were recorded in March 2020, an 8% decrease compared to March 2019.
- Due to the Covid-19 situation, the commuter cyclist movements have decreased significantly after the lockdown, but recreational cyclist movements have increased in residential areas. Overall cycling demand reduced by approximately 50% after the lockdown.
Download the March 2020 automatic cycle counter data (CSV, 20KB)
February 2020 automatic cycle counts
At 26 count sites:
- 3.8 million cycle movements were recorded for the year of March 2019 to February 2020, an increase of 4.1% on the previous 12 months.
- 408,000 cycle movements were recorded in February 2020, an 11% increase compared to February 2019.
There are many roadworks within the city centre such as Quay Street, Victoria Street and K Road and therefore, naturally some cyclists avoid those locations. We do try to capture all the cyclists through the work sites by working with the temporary traffic management when we can. Some sites however, have to be estimated.
Download the February 2020 automatic cycle counter data (CSV 20KB)
January 2020 automatic cycle counts
At 26 count sites:
- 3.76 million cycle movements were recorded for the year of February 2019 to January 2020, an increase of 4.7% on the previous 12 months.
- 359,000 cycle movements were recorded in January 2020, a decrease of 0.6% when compared to January 2019.
There are many roadworks within the city centre such as Quay Street, Victoria Street and K Road and therefore, naturally some cyclists avoid those locations. We do try to capture all the cyclists through the work sites by working with the temporary traffic management when we can. Some sites however, have to be estimated.
Download the January 2020 automatic cycle counter data (CSV 20KB)
2019 monthly cycle monitoring reports
- The Nelson Street counter and Quay Street display temporary counter have had their settings adjusted to detect scooters and other similar devices such as skateboards. Neither of these counters are part of the 26 counters grouped above. We are closely monitoring this to ensure it doesn’t adversely affect the quality of counts before adjusting the setting of all counters. Note that it is not possible with current technology to distinguish between cycles and scooters.
- The Lagoon Drive cycle counter has been reconfigured to capture more cycle movements on the footpath. This affects the ability to assess trends at this particular location.
- The Quay Street display cycle counter stopped working on 27 November. Since then a temporary counter has been laid. Missing data has been estimated based on historic data.
- The cycle counter at Mangere Bridge was decommissioned on 25 November due to the closure of that bridge. It was relocated to a suitable location near the alternative route on 21 January.
Download the January to December 2019 Auckland cycle counter data (CSV, 68KB)
December 2019 automatic cycle counts
At 26 city count sites:
- 3.77 million cycle movements were recorded for the year of January to December 2019, an increase of 6.2% on the previous 12 months.
- 305,000 cycle movements were recorded in December 2019, an increase of 4.5% when compared to December 2018.
November 2019 automatic cycle counts
At 26 city count sites:
- 3.75 million cycle movements were recorded for the year of December 2018 to November 2019, an increase of 5% on the previous 12 months.
- 350,000 cycle movements were recorded in November 2019, an increase of 9.3% when compared to November 2018.
October 2019 automatic cycle counts
At 26 city count sites:
- 3.72 million cycle movements were recorded for the year of November 2018 to October 2019, an increase of 3.8% on the previous 12 months.
- 305,000 cycle movements were recorded in October 2019, a decrease of 7.3% when compared to October 2018.
September 2019 automatic cycle counts
At 26 city count sites:
- 3.75 million cycle movements were recorded for the year of October 2018 to September 2019, an increase of 5.9% on the previous 12 months.
- 270,000 cycle movements were recorded in September 2019, a decrease of 3.8% when compared to September 2018.
- It was another wet month with 125mm rainfall compared to the 64mm historical average rainfall.
August 2019 automatic cycle counts
At 26 city count sites:
- 3.76 million cycle movements were recorded for the year of September 2018 to August 2019, an increase of 7.3% on the previous 12 months.
- 232,000 cycle movements were recorded in August 2019, a decrease of 11.2% when compared to August 2018.
- It was a very wet August with 190 mm rainfall compared to the 97 mm historical average rainfall.
July 2019 automatic cycle counts
At 26 city count sites:
- 3.79 million cycle movements were recorded for the year of August 2018 to July 2019, an increase of 8.3% on the previous 12 months.
- 266,000 cycle movements were recorded in July 2019, an increase of 5.9% when compared to July 2018.
June 2019 automatic cycle counts
At 26 city count sites:
- 3.77 million cycle movements were recorded for the year of July 2018 to June 2019, an increase of 8.9% on the previous 12 months.
- 272,000 cycle movements were recorded in June 2019, an increase of 16.7% when compared to June 2018.
- We exceeded the 2018/19 target by 3.5%.
May 2019 automatic cycle counts
At 26 city count sites:
- 3.70 million cycle movements were recorded for the year of June 2018 to May 2019, an increase of 7.1% on the previous 12 months.
- 337,000 cycle movements were recorded in May 2019, an increase of 10.1% when compared to May 2018.
- A record high of 1 million trips over Autumn.
April 2019 automatic cycle counts
At 26 city count sites:
- 3.70 million cycle movements were recorded for the year of May 2018 to April 2019, an increase of 6.5% on the previous 12 months.
- 311,000 cycle movements were recorded in April 2019, an increase of 6.0% when compared to April 2018.
March 2019 automatic cycle counts
At 26 city count sites:
- 3.68 million cycle movements were recorded for the year of April 2018 to March 2019, an increase of 6.0% on the previous 12 months.
- 388,000 cycle movements were recorded in March 2019, an increase of 8.3% when compared to March 2018.
February 2019 automatic cycle counts
At 26 city count sites:
- 3.65 million cycle movements were recorded for the year of March 2018 to February 2019, an increase of 6.2% on the previous 12 months.
- 368,000 cycle movements were recorded in February 2019, an increase of 20% when compared to February 2018.
January 2019 automatic cycle counts
At 26 city count sites:
- 3.593 million cycle movements were recorded for the year of February 2018 to January 2019, an increase of 4% on the previous 12 months.
- 361,000 cycle movements were recorded in January 2019, an increase of 15.1% when compared to January 2018.
2018 monthly cycle monitoring reports
- In November the Lagoon Drive cycle counter has been reconfigured to capture more cycle movements on the footpath. This affects the ability to assess trends at this particular location.
- The Quay Street display cycle counter stopped working on 27 November. Since then a temporary counter has been laid. Missing data has been estimated based on historic data.
- The cycle counter at Mangere Bridge was decommissioned on 25 November due to the closure of that bridge. It was relocated to a suitable location near the alternative route on 21 January. Missing data has been estimated based on historic data.
Download the January to December 2018 Auckland cycle counter data (CSV, 64KB)
December 2018 automatic cycle counts
At 26 city count sites:
- 3.546 million cycle movements were recorded for the year of January to December 2018, an increase of 2.6% on the previous 12 months.
- 292,000 cycle movements were recorded in December 2018, a decrease of 9.0% when compared to December 2017.
November 2018 automatic cycle counts
At 26 city count sites:
- 3.574 million cycle movements were recorded for the year of December 2017 to November 2018, an increase of 4.7% on the previous 12 months.
- 320,000 cycle movements were recorded in November 2018, a decrease of 4.0% when compared to November 2017.
October 2018 automatic cycle counts
At 26 city count sites:
- 3.587 million cycle movements were recorded for the year of November 2017 to October 2018, an increase of 6.8% on the previous 12 months.
- 329,000 cycle movements were recorded in October 2018, an increase of 17.1% when compared to October 2017.
September 2018 automatic cycle counts
At 26 city count sites:
- 3.539 million cycle movements were recorded for the year of October 2017 to September 2018, an increase of 5.6% on the previous 12 months.
- 281,000 cycle movements were recorded in September 2018, an increase of 15.5% when compared to September 2017.
August 2018 automatic cycle counts
At 26 city count sites:
- 3.501 million cycle movements were recorded for the year of September 2017 to August 2018, an increase of 4.9% on the previous 12 months.
- 261,000 cycle movements were recorded in August 2018, an increase of 2.0% when compared to August 2017.
July 2018 automatic cycle counts
At 26 city count sites:
- 3.496 million cycle movements were recorded for the year of August 2017 to July 2018, an increase of 5.2% on the previous 12 months.
- 251,000 cycle movements were recorded in July 2018, an increase of 15.0% when compared to July 2017.
June 2018 automatic cycle counts
At 14 regional count sites:
- 1.807 million cycle movements were recorded for the year of July 2017 to June 2018, an increase of 3.7% on the previous 12 months.
- 123,116 cycle movements were recorded in June 2018, a decrease of 8.1% when compared to June 2017.
At 13 city centre count sites:
- 1.845 million cycle movements were recorded for the year of July 2017 to June 2018, an increase of 4.8% on the previous 12 months.
- 123,125 cycle movements were recorded in June 2018, a decrease of 9.6% when compared to June 2017.
May 2018 automatic cycle counts
At 14 regional count sites:
- 1.818 million cycle movements were recorded for the year of June 2017 to May 2018, an increase of 5.3% on the previous 12 months.
- 156,971 cycle movements were recorded in May 2018, an increase of 1.7% when compared to May 2017.
At 13 city centre count sites:
- 1.858 million cycle movements were recorded for the year of June 2017 to May 2018, an increase of 6.4% on the previous 12 months.
- 168,152 cycle movements were recorded in May 2018, an increase of 4.4% when compared to May 2017.
April 2018 automatic cycle counts
At 14 regional count sites:
- 1.815 million cycle movements were recorded for the year of May 2017 to April 2018, an increase of 5.9% on the previous 12 months.
- 151,552 cycle movements were recorded in April 2018, a decrease of 2.0% when compared to April 2017.
At 13 city centre count sites:
- 1.853 million cycle movements were recorded for the year of May 2017 to April 2018, an increase of 6.7% on the previous 12 months.
- 157,397 cycle movements were recorded in April 2018, an increase of 4.4% when compared to April 2017.
March 2018 automatic cycle counts
At 14 regional count sites:
- 1.818 million cycle movements were recorded for the year of April 2017 to March 2018, an increase of 6.0% on the previous 12 months.
- 184,810 cycle movements were recorded in March 2018, an increase of 7.3% when compared to March 2017.
At 13 city centre count sites:
- 1.846 million cycle movements were recorded for the year of April 2017 to March 2018, an increase of 5.4% on the previous 12 months.
- 193,530 cycle movements were recorded in March 2018, an increase of 11.8% when compared to March 2017.
February 2018 automatic cycle counts
At 14 regional count sites:
- 1.806 million cycle movements were recorded for the year of March 2017 to February 2018, an increase of 5.6% on the previous 12 months.
- 161,167 cycle movements were recorded in February 2018, a decrease of 5.4% when compared to February 2017.
At 13 city centre count sites:
- 1.826 million cycle movements were recorded for the year of March 2017 to February 2018, an increase of 3.7% on the previous 12 months.
- 161,171 cycle movements were recorded in February 2018, a decrease of 1.9% when compared to February 2017.
January 2018 automatic cycle counts
At 14 regional count sites:
- 1.815 million cycle movements were recorded for the year of February 2017 to January 2018, an increase of 6.8% on the previous 12 months.
- 163,657 cycle movements were recorded in January 2018, a decrease of 1.5% when compared to January 2017.
At 13 city centre count sites:
- 1.829 million cycle movements were recorded for the year of February 2017 to January 2018, an increase of 3.7% on the previous 12 months.
- 164,140 cycle movements were recorded in January 2018, an increase of 1.3% when compared to January 2017.
2017 monthly cycle monitoring reports
Download the January to December 2017 Auckland cycle counter data (CSV, 55KB)
December 2017 automatic cycle counts
At 14 regional count sites:
- 1.818 million cycle movements were recorded for the year of January to December 2017, an increase of 7.9% on the previous 12 months.
- 168,452 cycle movements were recorded in December 2017, an increase of 14.9% when compared to December 2016.
At 13 city centre count sites:
- 1.827 million cycle movements were recorded for the year of January to December 2017, an increase of 3.7% on the previous 12 months.
- 166,919 cycle movements were recorded in December 2017, an increase of 14.5% when compared to December 2016.
November 2017 automatic cycle counts
At 14 regional count sites:
- 1.796 million cycle movements were recorded for the year of December 2016 to November 2017, an increase of 7.0% on the previous 12 months.
- 172,888 cycle movements were recorded in November 2017, an increase of 18.9% when compared to November 2016.
At 13 city centre count sites:
- 1.806 million cycle movements were recorded for the year of December 2016 to November 2017, an increase of 1.3% on the previous 12 months.
- 177,574 cycle movements were recorded in November 2017, an increase of 19.4% when compared to November 2016.
October 2017 automatic cycle counts
At 14 regional count sites:
- 1.768 million cycle movements were recorded for the year of November 2016 to October 2017, an increase of 5.7% on the previous 12 months.
- 149,140 cycle movements were recorded in October 2017, an increase of 2.8% when compared to October 2016.
At 13 city centre count sites:
- 1.777 million cycle movements were recorded for the year of November 2016 to October 2017.
- 147,516 cycle movements were recorded in October 2017, an increase of 1.6% when compared to October 2016.
September 2017 automatic cycle counts
At 14 regional count sites:
- 1.764 million cycle movements were recorded for the year of October 2016 to September 2017, an increase of 6.1% on the previous 12 months.
- 128,665 cycle movements were recorded in September 2017, an increase of 8.0% when compared to September 2016.
At 13 city centre count sites:
- 1.774 million cycle movements were recorded for the year of October 2016 to September 2017.
- 128,519 cycle movements were recorded in September 2017, an increase of 3.8% when compared to September 2016.
August 2017 automatic cycle counts
At 14 regional count sites:
- 1.755 million cycle movements were recorded for the year of September 2016 to August 2017, an increase of 5.9% on the previous 12 months.
- 131,751 cycle movements were recorded in August 2017, an increase of 6.8% when compared to August 2016.
At 13 city centre count sites:
- 1.770 million cycle movements were recorded for the year of September 2016 to August 2017.
- 139,785 cycle movements were recorded in August 2017, an increase of 6.1% when compared to August 2016.
July 2017 automated cycle counts
At 14 regional count sites:
- 1.746 million cycle movements were recorded for the year of August 2016 to July 2017, an increase of 6.3% on the previous 12 months.
- 114,871 cycle movements were recorded in July 2017, an increase of 3.7% when compared to July 2016.
At 13 city centre count sites:
- 1.762 million cycle movements were recorded for the year of August 2016 to July 2017.
- 117,602 cycle movements were recorded in July 2017, an increase of 0.9% when compared to July 2016.
June 2017 automated cycle counts
At 14 regional count sites:
- 1.742 million cycle movements were recorded for the year of July 2016 to June 2017, an increase of 6.8% on the previous 12 months.
- 134,026 cycle movements were recorded in June 2017, an increase of 13.3% when compared to June 2016.
At 13 city centre count sites:
- 1.761 million cycle movements were recorded for the year of July 2016 to June 2017.
- 136,138 cycle movements were recorded in June 2017, an increase of 12.3% when compared to June 2016. (Note that Lightpath was closed from 6 – 15 June for repainting).
May 2017 automated cycle counts
At 14 regional count sites:
- 1.727 million cycle movements were recorded for the year of June 2016 to May 2017, an increase of 6.4% on the previous 12 months.
- 154,342 cycle movements were recorded in May 2017, an crease of 9.2% when compared to May 2016.
At 13 city centre count sites:
- 1.746 million cycle movements were recorded for the year of June 2016 to May 2017.
- 162,628 cycle movements were recorded in May 2017, an increase of 6.0% when compared to May 2016.
April 2017 automated cycle counts
At 14 regional count sites:
- 1.713 million cycle movements were recorded for the year: May 2016 to April 2017, an increase of 6.8% on the previous 12 months.
- 154,645 cycle movements were recorded in April 2017, a decrease of 1.4%
At 13 city-centre count sites:
- 1.737 million cycle movements were recorded for the year: May 2016 to April 2017
- 150,715 cycle movements were recorded in April 2017, a decrease of 9.2% when compared to April 2016
March 2017 automated cycle counts
At 14 regional count sites:
- 1.716 million cycle movements were recorded for the year: April 2016 to March 2017, an increase of 8.6% on the previous 12 months.
- 172,272 cycle movements were recorded in March 2017, an increase of 3.6%.
At 13 city-centre count sites:
- 1.752 million cycle movements were recorded for the year: April 2016 to March 2017.
- 173,181 cycle movements were recorded in March 2017, a decrease of 4.8% when compared to March 2016 (note that the Lightpath was closed from 1-7 March).
February 2017 automated cycle counts
At 14 regional count sites:
- 1.710 million cycle movements were recorded for the year of March 2016 to February 2017, an increase of 8.8% on the previous 12 months.
- 170,452 cycle movements were recorded in February 2017, an increase of 6.7%.
At 13 city-centre count sites:
- 1.761 million cycle movements were recorded for the year of March 2016 to February 2017.
- 164,346 cycle movements were recorded in February 2017, a decrease of 1.8% when compared to February 2016.
January 2017 automated cycle counts
At 14 regional count sites:
- 1.700 million cycle movements were recorded for the year of February 2016 to January 2017, an increase of 8.8% on the previous 12 months.
- 166,130 cycle movements were recorded in January 2017, an increase of 9.6%.
At 13 city-centre count sites:
- 1.764 million cycle movements were recorded for the year of February 2016 to January 2017.
- 162,055 cycle movements were recorded in January 2017, an increase of 1.3% when compared to January 2016.
2016 monthly cycle monitoring reports
Download the January to December 2016 Auckland cycle counter data (CSV, 48KB)
December 2016 automated cycle counts
At 14 regional count sites:
- 1.68 million cycle movements were recorded for the year of January to December 2016, an increase of 7.2% on the previous 12 months.
- 145,097 cycle movements were recorded in December 2016, an increase of 2.9%.
At 13 city centre count sites:
- 1.76 million cycle movements were recorded for the year of January to December 2016.
- 145,826 cycle movements were recorded in December 2016, a decrease of 12.4% when compared to December 2015.
November 2016 automated cycle counts
At 14 regional count sites:
- 1.67 million cycle movements were recorded for the year of December 2015 to November 2016, an increase of 8.5% on the previous 12 months.
- 145,422 cycle movements were recorded in November 2016, an increase of 4.5% when compared to November 2015.
At 13 city centre count sites:
- 1.77 million cycle movements were recorded for the year of December 2015 to November 2016.
- 147,468 cycle movements were recorded in November 2016, an increase of 12.8% when compared to November 2015.
October 2016 automated cycle counts
At 14 regional count sites:
- 1.67 million cycle movements were recorded for the year of November 2015 to October 2016, an increase of 8.9% on the previous 12 months.
- 145,039 cycle movements were recorded in October 2016, an increase of 7.0% when compared to October 2015.
At 13 city centre count sites:
- 1.76 million cycle movements were recorded/estimated for the year of November 2015 to October 2016.
- 144,017 cycle movements were recorded in October 2016.
September 2016 automated cycle counts
At 14 regional count sites:
- 1.66 million cycle movements were recorded for the year of October 2015 to September 2016, an increase of 8.8% on the previous 12 months.
- 119,142 cycle movements were recorded in September 2016, an increase of 4.8% when compared to September 2015.
At 13 city centre count sites:
- 1.75 million cycle movements were recorded/estimated for the year of October 2015 to September 2016.
- 122,697 cycle movements were recorded in September 2016.
August 2016 automated cycle monitoring report
At 14 regional count sites:
- 1.66 million cycle movements were recorded for the year of September 2015 to August 2016, an increase of 8.8% on the previous 12 months.
- 123,388 cycle movements were recorded in August 2016, an increase of 13.9% when compared to August 2015.
At 13 city centre count sites:
- 1.74 million cycle movements were recorded/estimated for the year of September 2015 to August 2016.
- 130,523 cycle movements were recorded in August 2016.
July 2016 automated cycle monitoring report
At 14 regional count sites:
- 1.64 million cycle movements were recorded for the year of August 2015 to July 2016, an increase of 8.1% on the previous 12 months.
- 110,822 cycle movements were recorded in July 2016, an increase of 11.3% when compared to July 2015.
At 13 city centre count sites:
- 1.71 million cycle movements were recorded/estimated for the year of August 2015 to July 2016.
- 115,518 cycle movements were recorded in July 2016.
June 2016 automated cycle monitoring report
At 9 count sites:
- There has been an increase of 15.1% in cycle movements in June 2016 when compared to June 2015.
- The morning peak movement’s increased by 11.8% when compared to June last year. Note that public holidays are not included in the morning peak count from October 2015. There was one public holiday day in June 2016.
- A total of 995,828 cycle movements were recorded for the year of July 2015 to June 2016, this is an increase of 9.9% on the previous year.
May 2016 automated cycle monitoring report
At 9 count sites:
- There has been an increase of 22.6% in cycle movements in May 2016 when compared to May 2015.
- The morning peak movement’s increased by 25.8% when compared to May last year.
- A total of 986,039 cycle movements were recorded for the year of June 2015 to May 2016, this is an increase of 9.3% on the previous year.
April 2016 automated cycle monitoring report
At 9 count sites:
- There has been an increase of 19.3% in cycle movements in April 2016 when compared to April 2015.
- The morning peak movement’s increased by 24.2% when compared to April last year. Note that public holidays are not included in the morning peak count from October 2015. There was one public holiday day in April 2016.
- A total of 969,696 cycle movements were recorded for the year of May 2015 to April 2016, this is an increase of 7.2% on the previous year.
March 2016 automated cycle monitoring report
At 9 count sites:
- There has been an increase of 7.0% in cycle movements in March 2016 when compared to March 2015.
- The morning peak movement’s decreased by 1.0% when compared to March last year. Note that public holidays are not included in the morning peak count from October 2015. There were two public holiday days in March 2016.
- A total of 954,153 cycle movements were recorded for the year of April 2015 to March 2016, this is an increase of 5.7% on the previous year.
February 2016 automated cycle monitoring report
At 9 count sites:
- There has been an increase of 6.4% in cycle movements in February 2016 when compared to February 2015.
- The morning peak movement’s increased by 2.1% when compared to February last year. Note that public holidays are not included in the morning peak count from October 2015. There were two public holiday days in February 2016.
- A total of 947,413 cycle movements were recorded for the year of March 2015 to February 2016, this is an increase of 5.2% on the previous year.
January 2016 automated cycle monitoring report
At 9 count sites:
- There has been a decrease of 5.3% in cycle movements in January 2016 when compared to January 2015.
- The morning peak movement’s decreased by 11.8% when compared to January last year. Note that public holidays are not included in the morning peak count from October 2015.
- A total of 941,466 cycle movements were recorded for the year of February 2015 to January 2016. This is an increase of 5.1% on the previous year.
2015 monthly cycle monitoring reports
December 2015 automated cycle monitoring report
At 9 count sites:
- There has been an increase of 20.0% in cycle movements in December 2015 when compared to December 2014.
- The morning peak movement’s increased by 19.3% when compared to December last year. Note that public holidays are not included in the 2015 morning peak count.
- A total of 946,749 cycle movements were recorded for the year of January to December 2015, this is an increase of 7.4% on the previous year.
November 2015 automated cycle monitoring report
At 9 count sites:
- There has been an increase of 10.6% in cycle movements in November 2015 when compared to November 2014.
- The morning peak movement’s increased by 32.3% when compared to November last year.
- A total of 932,302 cycle movements were recorded for the year of December 2014 to November 2015, this is an increase of 5.6% on the previous year.
October 2015 automated cycle monitoring report
At 9 count sites:
- There has been an increase of 6.0% in cycle movements in October 2015 when compared to October 2014.
- The morning peak movement’s increased by 0.7% when compared to October last year. Note that from October 2015 public holidays are no longer included in morning peak counts.
- A total of 924,286 cycle movements were recorded for the year of November 2014 to October 2015, this is an increase of 3.7% on the previous year.
September 2015 automated cycle monitoring report
At 9 count sites:
- There has been an increase of 6.3% in cycle movements in September 2015 when compared to September 2014.
- The morning peak movement’s decreased by 3.1% when compared to September last year.
- A total of 919,703 cycle movements were recorded for the year of October 2014 to September 2015, this is an increase of 2.27% on the previous year.
Please note: The September 2015 counts differ to those originally reported. It has recently been discovered that the counter at Lake Rd was not functioning correctly. The counts have since been revised to better reflect what the actual count would have been.
August 2015 automated cycle monitoring report
At 9 count sites:
- There has been an increase of 7.3% in cycle movements in August 2015 when compared to August 2014.
- The morning peak movement’s increased by 9.7% when compared to August last year.
- A total of 915,664 cycle movements were recorded for the year of September 2014 to August 2015, this is an increase of 2.26% on the previous year.
July 2015 automated cycle monitoring report
At 9 count sites:
- There has been an increase of 9.1% in cycle movements in July 2015 when compared to July 2014.
- The morning peak movement’s increased by 10.8% when compared to July last year.
- A total of 911,350 cycle movements were recorded for the year of August 2014 to July 2015, this is an increase of 1.20% on the previous year.
June 2015 automated cycle monitoring report
At 9 count sites:
- There has been an increase of 6.9% in cycle movements in June 2015 when compared to June 2014.
- The morning peak movement’s increased by 23.4% when compared to June last year.
- A total of 906,518 cycle movements were recorded for the year of July 2014 to June 2015, this is a decrease of 1.0% on the previous year.
May 2015 automated cycle monitoring report
At 9 count sites:
- There has been a decrease of 3.4% in cycle movements in May 2015 when compared to May 2014.
- The morning peak movement’s increased by 0.1% when compared to May last year.
- A total of 902,343 cycle movements were recorded for the year of June 2014 to May 2015, this is a decrease of 0.8% on the previous year.
April 2015 automated cycle monitoring report
At 9 count sites:
- There has been an increase of 3.3% in cycle movements in April 2015 when compared to April 2014.
- The morning peak movement’s increased by 1.4% when compared to April last year.
- A total of 904,901 cycle movements were recorded for the year of May 2014 to April 2015, this is an increase of 0.9% on the previous year.
March 2015 automated cycle monitoring report
At 9 count sites:
- There has been an increase of 1.9% in cycle movements in March 2015 compared to March 2014.
- Morning peak movements increased by 8.8% compared to March last year.
- A total of 902,343 cycle movements were recorded for the year April 2014 to March 2015. This is an increase of 0.8% from the previous year.
February 2015 automated cycle monitoring report
At 9 count sites:
- There has been an increase of 5.6% in cycle movements in February 2015 when compared to February 2014.
- The morning peak movements increased by 6.1% when compared to February last year.
- A total of 900,531cycle movements were recorded for the year of March 2014 to February 2015. This is an increase of 1.5% from the previous year.
January 2015 automated cycle monitoring report
At 9 count sites:
- There has been an increase of 16.4% in cycle movements in January 2015 when compared to January 2014.
- The morning peak movements increased by 18.9% when compared to January last year.
- A total of 895,586 cycle movements were recorded for the year of February 2014 to January 2015. This is an increase of 0.9% from the previous year.
2014 monthly cycle monitoring reports
December 2014 automated cycle monitoring report
At 9 count sites:
- There has been a decrease of 1.9% in cycle movements in December 2014 when compared to December 2013.
- The morning peak movements increased by 2.0% when compared to December last year.
- A total of 881,620 cycle movements were recorded for the year of January 2014 to December 2014, this is a decrease of 0.8% on the previous year.
November 2014 automated cycle monitoring report
At 9 count sites:
- There has been a decrease of 9.8% in cycle movements in November 2014 when compared to November 2013.
- The morning peak movement’s decreased by 22.5% when compared to November last year.
- A total of 883,031 cycle movements were recorded for the year of December 2013 to November 2014, this is an increase of 0.2% on the previous year.
October 2014 automated cycle monitoring report
At 9 count sites:
- There has been a decrease of 9.5% in cycle movements in October 2014 when compared to October 2013.
- The morning peak movement’s increased by 0.5% when compared to October last year.
- A total of 891,245 cycle movements were recorded for the year of November 2013 to October 2014, this is an increase of 2.3% on the previous year.
September 2014 automated cycle monitoring report
At 9 count sites:
- There has been an increase of 6.3% in cycle movements in September 2014 when compared to September 2013.
- The morning peak movement’s increased by 31.3% when compared to September last year.
- A total of 899,251 cycle movements were recorded for the year of October 2013 to September 2014, this is an increase of 5.4% on the previous year.
August 2014 automated cycle monitoring report
At 9 count sites:
- There has been a decrease of 7.9% in cycle movements in August 2014 when compared to August 2013.
- The morning peak movement’s decreased by 2.5% when compared to August last year.
- A total of 895,468 cycle movements were recorded for the year of September 2013 to August 2014, this is an increase of 4.8% on the previous year.
July 2014 automated cycle monitoring report
At 9 count sites:
- There has been a decrease of 21.9% in cycle movements in July 2014 when compared to July 2013.
- The morning peak movement’s decreased by 6.0% when compared to July last year.
- A total of 900,543 cycle movements were recorded for the year of August 2013 to July 2014, this is an increase of 5.7% on the previous year.
June 2014 automated cycle monitoring report
At 9 count sites:
- There has been an increase of 11.4% in cycle movements in June 2014 when compared to June 2013.
- The morning peak movement’s increased by 18.7% when compared to June last year.
- A total of 915,458 cycle movements were recorded for the year July 2013 to June 2014, this is an increase of 9.6% on the previous year.
May 2014 automated cycle monitoring report
At 9 count sites:
- There has been an increase of 19.5% in cycle movements in May 2014 when compared to May 2013.
- The morning peak movement’s increased by 23.8% when compared to May last year.
- A total of 909,234 cycle movements were recorded for the year June 2013 to May 2014, this is an increase of 8.8% on the previous year.
April 2014 automated cycle monitoring report
At 9 count sites:
- There has been an increase of 2.5% in cycle movements in April 2014 when compared to April 2013.
- The morning peak movement’s increased by 13.4% when compared to April last year.
- A total of 897,039 cycle movements were recorded for the year May 2013 to April 2014, this is an increase of 7.05% on the previous year.
March 2014 automated cycle monitoring report
At 9 count sites:
- There has been an increase of 9.2% in cycle movements in March 2014 when compared to March 2013.
- The morning peak movement’s increased by 19.7% when compared to March last year.
- A total of 895,165 cycle movements were recorded for the year April 2013 to March 2014, this is an increase of 6.6% on the previous year.
February 2014 automated cycle monitoring report
At 9 count sites:
- There has been a decrease of 0.5% in cycle movements in February 2014 when compared to February 2013.
- The morning peak movement’s increased by 16.3% when compared to February last year.
- A total of 887,203 cycle movements were recorded for the year March 2013 to February 2014, this is an increase of 7.2% on the previous year.
January 2014 automated cycle monitoring report
At 9 count sites:
- There has been a decrease of 1.6% in cycle movements in January 2014 when compared to January 2013.
- The morning peak movement’s increased by 15.5% when compared to January last year.
- A total of 887,691 cycle movements were recorded for the year February 2013 to January 2014, this is an increase of 8.11% on the previous year.
Download monthly counts from each site from November 2010 - December 2019 (CSV, 28KB)
About the data
The 26 cycle counters, with their latitude and longitude coordinates in brackets, are:
- Beach Road (-36.849384,174.77441)
- Curran Street (-36.83941853,174.7393543)
- East Coast Road (-36.74176,174.74125)
- Grafton Bridge (-36.860126,174.76648)
- Grafton Gully (-36.85532,174.76896)
- Grafton Road (-36.85407,174.7708)
- Great South Road (-36.9875,174.88219)
- Highbrook shared path (-36.95042001,174.8594606)
- Hopetoun Street (-36.85609341,174.7575115)
- Karangahape Road (-36.85819556,174.7563792)
- Lagoon Drive (-36.90941,174.85966)
- Lake Road (-36.8026127,174.7874993)
- Lightpath (-36.8595,174.75861)
- Mangere Bridge (-36.93486249,174.7864147)
- Northwestern Cycleway in Kingsland (-36.86918,174.74402)
- Northwestern Cycleway in Te Atatū (-36.85874,174.65397)
- Orewa shared path (-36.59645,174.69408)
- Quay Street near Spark Arena (-36.84649,174.77784)
- SH20 shared path near Dominion Road (-36.91207,174.74008)
- Symonds Street (-36.86117,174.76203)
- Tamaki Drive on both sides of the road (-36.84916,174.79327)
- Twin Streams shared path (-36.87925,174.62383)
- Upper Harbour Drive (-36.78231,174.67536)
- Upper Queen Street (-36.85928,174.76064)
- Victoria Street West (-36.84805,174.75366)
- Wynyard Crossing or Te Wero Bridge (-36.84148,174.76064).
This equipment counts the number of cycle movements all day, every day. We use the data collected for a variety of reasons including:
- identifying trends in cycling
- guiding policy and the investment in cycling
- reporting to the public on the use of the cycle network.
To find out about the counter products we use, go to the Eco-counter website (opens in a new tab).